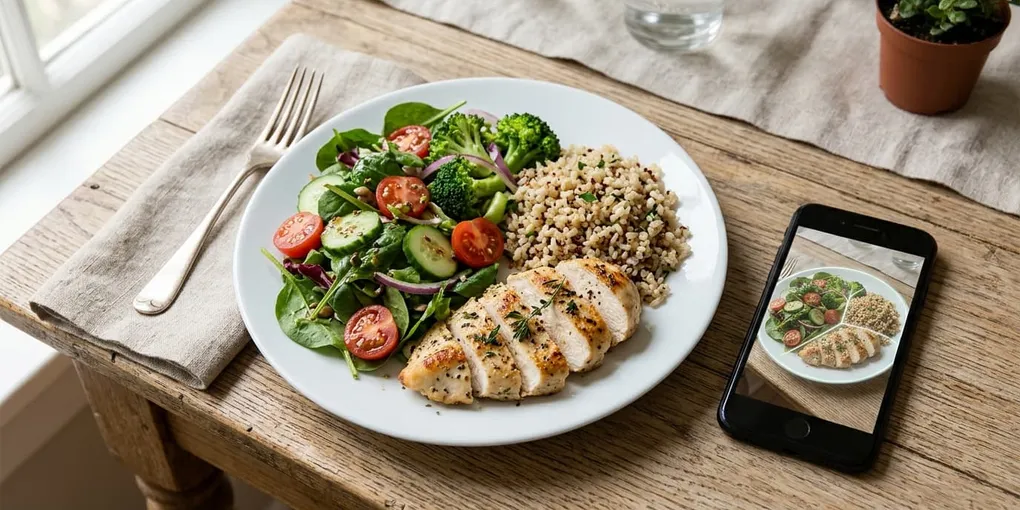
Portion Size Estimation: How Accurate Is AI Compared to the Human Eye?
Human eye estimation underestimates food portions by 20 to 50 percent. Discover how computer vision and plate ratio analysis eliminate optical diet bias.
Human visual estimation fails systematically because optical illusions and cognitive biases distort perception, causing people to underestimate meal portions by twenty to fifty percent. Computer vision analyzes plate geometry and relative sector boundaries objectively. By measuring surface proportions rather than guessing invisible gram weights, artificial intelligence achieves portion balance accuracy exceeding eighty five percent.
Key Takeaways
- Human visual estimation underestimates portion volume by 20 to 50 percent due to established cognitive biases like the Delboeuf illusion and health halos.
- Kitchen scales offer high laboratory precision, yet manual weighing requires fifteen minutes daily and triggers severe dietary burnout within weeks.
- Computer vision segments plate areas objectively, measuring relative surface ratios across vegetables, proteins, and complex carbohydrates without scales.
- Plate ratio analysis bypasses 3D depth estimation limitations by tracking visual proportions proven effective by Harvard nutritional guidelines.
- Objective visual feedback trains natural intuitive portion awareness, permanently reducing mindless overeating in social and restaurant environments.
Why Does the Human Eye Fail at Estimating Portion Sizes?
Visual estimation feels natural, yet human psychology actively misjudges food quantities on a daily basis. Controlled nutritional trials consistently demonstrate that lean individuals underestimate meal energy intake by twenty to thirty percent, while individuals struggling with excess weight frequently underestimate calorie intake by up to forty five percent. This discrepancy rarely stems from dishonesty. Rather, human cognitive architecture relies on flawed visual heuristics.
The primary culprit is the Delboeuf illusion. When identical food volumes are served on a large dinner plate, the surrounding empty rim makes the portion appear significantly smaller than it truly is. Diners instinctively add thirty to forty percent more food to fill the perceived void. Conversely, small plates make standard portions appear overwhelming.
Human perception also suffers from the well documented health halo bias. When people consume foods labeled natural, organic, or wholesome, their brains unconsciously assign them negligible energetic impact. Olive oil drizzled over salad leaves, handfuls of raw walnuts, and generous scoops of creamy guacamole are routinely estimated at half their true volume.
Cognitive Distortion Cycle:
Large Dinner Plate -> Empty Rim Gap -> Delboeuf Optical Bias -> Portion Underestimated -> Unconscious Overeating
In addition, three dimensional volume is notoriously difficult for the human binocular system to quantify without reference points. A mound of pasta that increases by just twenty percent in height doubles in total volume due to cubic scaling laws. The human eye evaluates surface area easily but fails to register vertical depth changes, creating substantial daily intake errors.
How Does Computer Vision Analyze Food on a Plate?
Modern artificial intelligence approaches food analysis through convolutional neural networks and transformer vision models. Rather than relying on subjective human impressions, computer vision processes food imagery through structured mathematical pipelines designed to segment textures, detect boundaries, and calculate geometric areas.
The technical pipeline follows four distinct operational stages:
- Object Detection and Plate Localization: The model identifies the primary container, correcting for perspective distortion and camera tilt angles relative to the table surface.
- Semantic Segmentation: Pixel level masks separate distinct meal components, distinguishing fibrous vegetables from cooked grains, legumes, and animal proteins.
- Relative Area Mapping: The algorithm calculates the percentage of the plate surface occupied by each identified nutritional category.
- Ratio Verification: The observed distribution is matched against validated nutritional benchmarks such as the Harvard Healthy Eating Plate standards.
Vision Pipeline:
Raw Image Capture -> Perspective Correction -> Semantic Segmentation -> Area Ratio Calculation -> Nutritional Feedback
By concentrating on surface ratios rather than uncalibrated three dimensional volume reconstruction, computer vision delivers consistent results across varying lighting conditions and camera models. While estimating absolute gram weight from a single two dimensional photograph remains challenging due to hidden moisture and oil layers, measuring plate proportions provides immediate, robust dietary feedback.
How Do Visual Estimation, Scales, and Computer Vision Compare?
Choosing a dietary tracking method requires balancing scientific precision against sustainable daily adherence. Laboratory scales provide exact gram measurements but demand tedious manual effort, while pure human estimation requires zero tools but leads to systemic portion drift.
The following comparative breakdown highlights how artificial intelligence bridges the gap between precision and lifestyle usability:
| Evaluation Metric | Human Eyeball Guesswork | Digital Kitchen Scales | Computer Vision (PlateTracker) |
|---|---|---|---|
| Typical Error Range | 20% to 50% underestimation | Under 3% in gram mass | Under 10% in sector ratios |
| Time Required per Meal | Instant (under 2 seconds) | 3 to 7 minutes of weighing | 3 seconds for photo scan |
| Cognitive Fatigue | Low initially, high anxiety | Extremely high friction | Minimal, zero manual logging |
| Restaurant Feasibility | High, but severely inaccurate | Near zero social acceptance | High, discrete photo capture |
| Vulnerability to Illusions | Extreme (Delboeuf, lighting) | None (measures gravitational mass) | Immune to psychological bias |
| Long Term Sustainability | Unreliable habit formation | 85% abandon within 30 days | Builds lasting intuitive visual habits |
Digital scales create obsessive food documentation behaviors that often sabotage mental well being. In contrast, computer vision provides immediate objective verification without turning breakfast, lunch, and dinner into numerical accounting exercises.
What Are the Scientific Limitations of Photo Based Portion Tracking?
Transparent scientific communication requires examining where optical artificial intelligence encounters physical constraints. A digital camera captures surface reflectance, meaning algorithms cannot observe ingredients buried beneath visible layers.
The first technical challenge involves hidden ingredients. Deep frying, dense butter dressings, and sugary sauces soak into food fibers without altering surface geometry. An algorithm sees steamed broccoli identically whether it contains one teaspoon of olive oil or three tablespoons of clarified butter.
The second challenge involves third dimension depth occlusion. Food piled into high vertical mounds presents a smaller surface footprint than flatly spread meals. While advanced depth estimation networks utilize shadow gradients and edge curvature to approximate food height, single camera angle shots retain minor geometric variance.
Optical Limits:
Visible Surface -> Captured Accurately by Segmentation
Hidden Underlayers -> Requires Standard Cooking Awareness
These physical realities explain why attempting to extract exact calorie counts from photos often produces false precision. Plate ratio tracking avoids this pitfall entirely. Instead of claiming to measure invisible micro calories, it evaluates whether your meal satisfies the half plate vegetable rule, quarter plate clean protein rule, and quarter plate whole carbohydrate rule outlined in our Harvard plate method guide.
Why Is Plate Ratio Analysis More Reliable Than Gram Guessing?
Public health nutritionists developed visual plate models specifically because humans cannot maintain lifelong gram tracking. When you understand food in relative sectors, portion control becomes effortless regardless of where you dine.
Evaluating proportions neutralizes the container size illusion. Whether you eat from a twenty centimeter lunch dish or a thirty centimeter restaurant platter, allocating fifty percent of the visible plate surface to leafy greens and cruciferous vegetables guarantees high dietary volume with low caloric density. This dynamic is thoroughly analyzed in our guide on eating fifty percent vegetables for fiber.
Harvard Plate Distribution:
[ 1/2 Plate: Crisp Vegetables & Fruits ]
[ 1/4 Plate: Lean Proteins ]
[ 1/4 Plate: Whole Grains & Complex Carbs ]
When computer vision confirms your plate geometry, several biological mechanisms trigger automatically:
- Gastric Stretch Receptor Activation: High vegetable volume activates stomach mechanoreceptors, sending satiety signals to the hypothalamus via the vagus nerve before excessive calories are ingested.
- Glycemic Flattening: High fiber content slows gastric emptying rates, preventing the rapid glucose and insulin spikes triggered by isolated refined carbohydrates.
- Reduced Decision Fatigue: Instead of debating whether a steak weighs one hundred forty or one hundred eighty grams, you simply verify that protein occupies its dedicated quarter sector.
Coupling artificial intelligence with visual proportions provides an ideal balance. The technology acts as an objective external eye, preventing subconscious portion drift while eliminating the tedious manual searching that plagues legacy tools, as detailed in our analysis of FatSecret and Lose It manual logging alternatives.
How Does Objective Visual Feedback Build Intuitive Eating Habits?
Relying entirely on digital devices can sometimes create external dependency. However, when visual artificial intelligence is used to confirm plate ratios, it functions as an educational biofeedback mechanism rather than a restrictive digital leash.
Studies on cognitive learning demonstrate that receiving immediate objective verification after making an intuitive estimate sharpens perceptual accuracy rapidly. By photographing your plate, reviewing the detected sector lines, and observing where your portions deviated from ideal ratios, your brain recalibrates its internal visual baseline within two to three weeks.
Learning Loop:
Eyeball Meal -> Capture Photo -> AI Verifies Sectors -> Perceptual Baseline Corrected -> Intuitive Accuracy
This psychological transformation shifts meal tracking from guilt inducing numerical restriction to mindful visual awareness, an approach explored in our study on photo food diaries versus calorie counting. Once calibrated, you retain this sharpened judgment when dining at business banquets, family celebrations, or vacation buffets without needing a phone in hand.
Frequently Asked Questions
Can artificial intelligence detect cooking oils and dressings hidden in dishes?
No optical camera system can detect transparent oils or invisible liquid ingredients absorbed inside food fibers. Computer vision calculates surface area and food boundaries accurately. To account for cooking fats, diners simply use consistent, mindful preparation methods or choose olive oil as their primary culinary dressing.
How does camera angle affect plate ratio estimation?
Extreme low angle perspectives distort circular plates into narrow ellipses, making background foods appear smaller than foreground items. For maximum accuracy, photos should be taken from a natural forty five degree angle or directly top down, allowing perspective correction algorithms to map the plate boundary evenly.
Why is sector ratio tracking better than trying to calculate exact calories from photos?
Attempting to calculate exact calories from a single photo creates an illusion of precision, because variations in water content and cooking fat can alter caloric density by thirty percent without changing food shape. Sector ratio tracking focuses on diet quality and volumetric satiety, which correlate far more strongly with sustained long term health.
Does AI portion estimation work with mixed bowls and stews?
Layered dishes present unique segmentation challenges because ingredients blend together. Advanced neural networks recognize mixed textures, estimating the dominant vegetable and protein balance. For complex bowls, spreading ingredients slightly before taking the photograph dramatically improves detection accuracy.
Build Lifelong Nutritional Balance With PlateTracker
Manual food scales belong in laboratory kitchens, not on your dining table. If you want sustainable nutrition without tedious database lookups or portion guessing games, upgrade to intelligent visual meal balancing.
Experience the freedom of objective, camera based plate analysis. Visit PlateTracker today, photograph your next meal, and master natural portion control effortlessly.
Sources and Scientific References
- Wansink, B., & van Ittersum, K. (2006). The visual illusions of food: Why plate size and shape influence portion perceptions. FASEB Journal, 20(4), A618.
- Chandon, P., & Wansink, B. (2007). The Biasing Health Halos of Fast-Food Restaurant Health Claims: Lower Calorie Estimates and Higher Side-Dish Consumption. Journal of Consumer Research, 34(3), 301-314.
- Rolls, B. J. (2014). What is the role of portion control in weight management? International Journal of Obesity, 38(Suppl 1), S1-S8.
- Fang, S., et al. (2019). Computer Vision-Based Dietary Assessment in Free-Living Individuals: Portion Size Estimation and Energy Intake. IEEE Journal of Biomedical and Health Informatics, 23(5), 1845-1854.
- Harvard T.H. Chan School of Public Health (2011). The Healthy Eating Plate: Visual Proportions and Nutritional Guidelines. Department of Nutrition, Harvard University.
Check Your Plate Balance by Photo
Snap your meal in PlateTracker. AI determines Harvard Plate proportions and nutrients in 3 seconds without scales.